Data is rarely consistent. The most consistent attribute of data is that it is usually dispersed across many files and needs to be put back together again to truly understand it.
Pivot Billions dramatically improves this process and makes it easy to merge your data and start to analyze it. As an example of this use case, we chose to analyze the disjointed 2012- 2017 National Hockey League (NHL) data from Kaggle. This is very interesting and potentially valuable data that describes various aspects of past NHL hockey games. It provides many views into the data from team statistics to to play-by-play results. However these views are each in distinct files that need to be merged.
With Pivot Billions we are able to easily select the datasets that we want to merge and put the pieces back together. This simple process is completed in two steps.
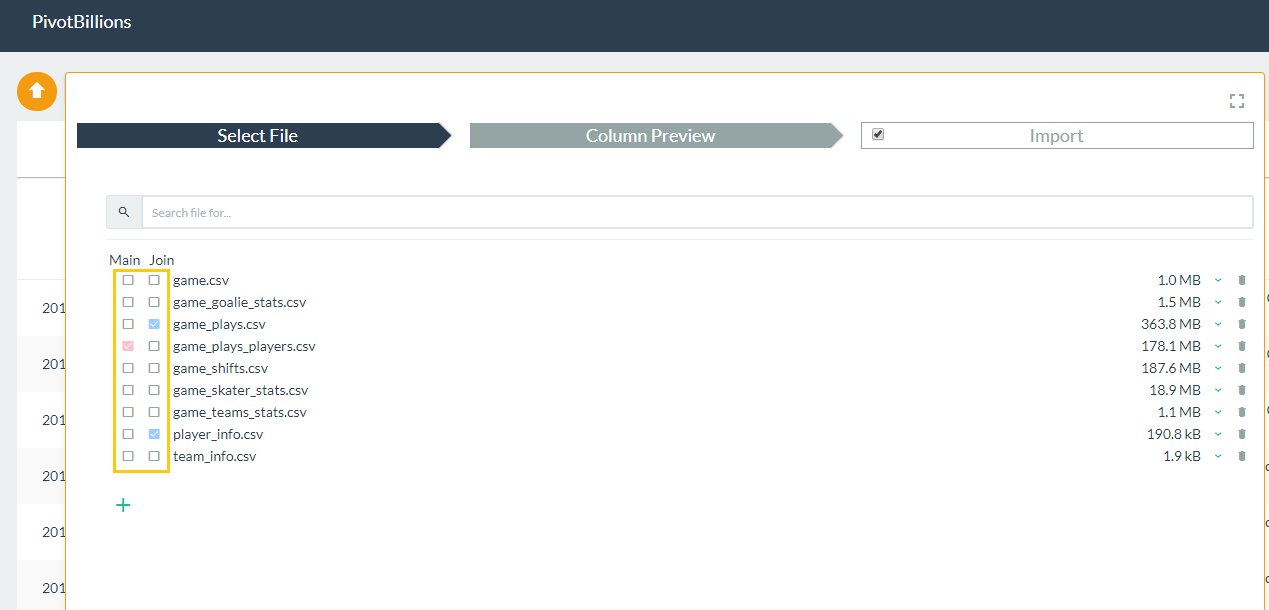
First, we select all of the files we want to merge:
Then we select what fields the files have in common and that we want to join by. This is made extremely simple through Pivot Billions’ easy Column Preview interface:
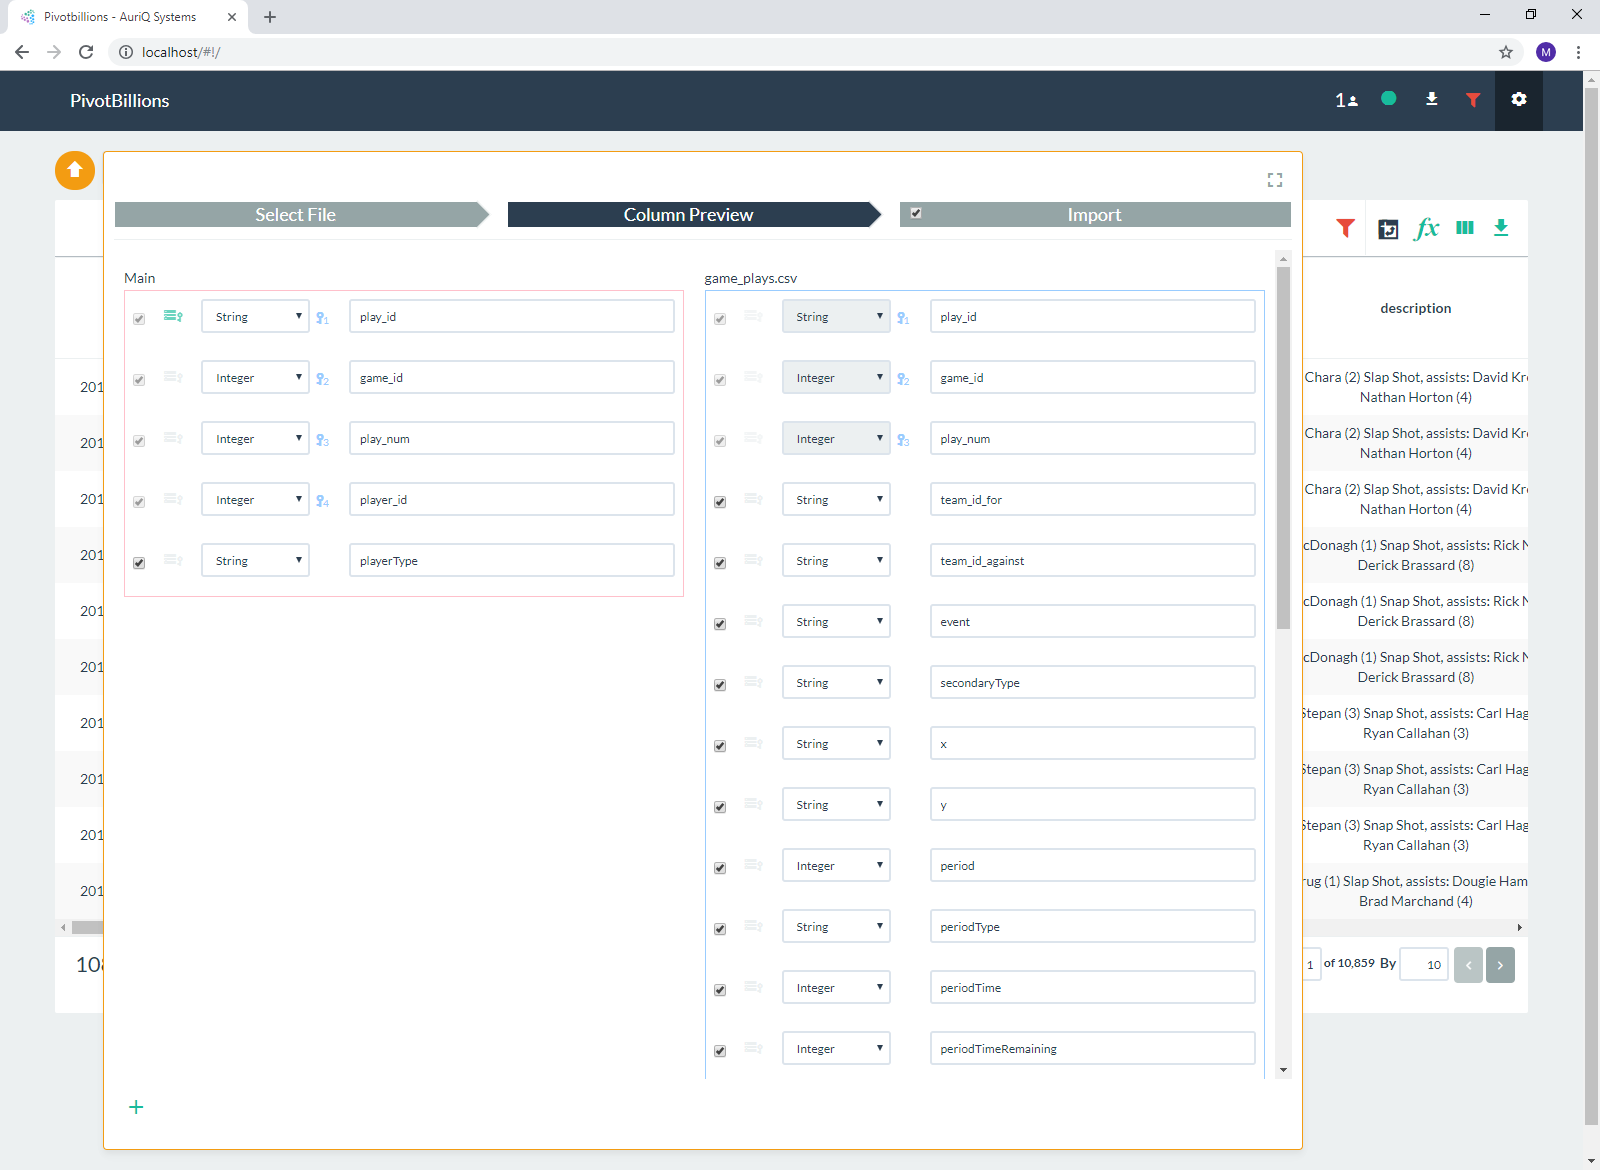
The data is now quickly imported into Pivot Billions and you have full access to the merged files.
We can now quickly and effortlessly analyze the data. Pivot Billions provide quick-analysis features such as viewing the distribution of each column in the data as well as powerful analysis features including creating new columns from the data and pivoting all of the data by any of its columns to get a new view of the data. This is one of Pivot Billions’ unique features and it allows us to quickly draw insights from the data.
For our example usecase we need to create an additional column to combine the first and last name of players using our f(x) column-creation feature.
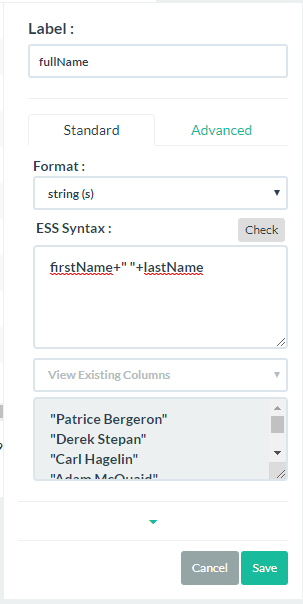
Then filter the event column for "Goal". Finally we pivot the data by player name, player position and player type.
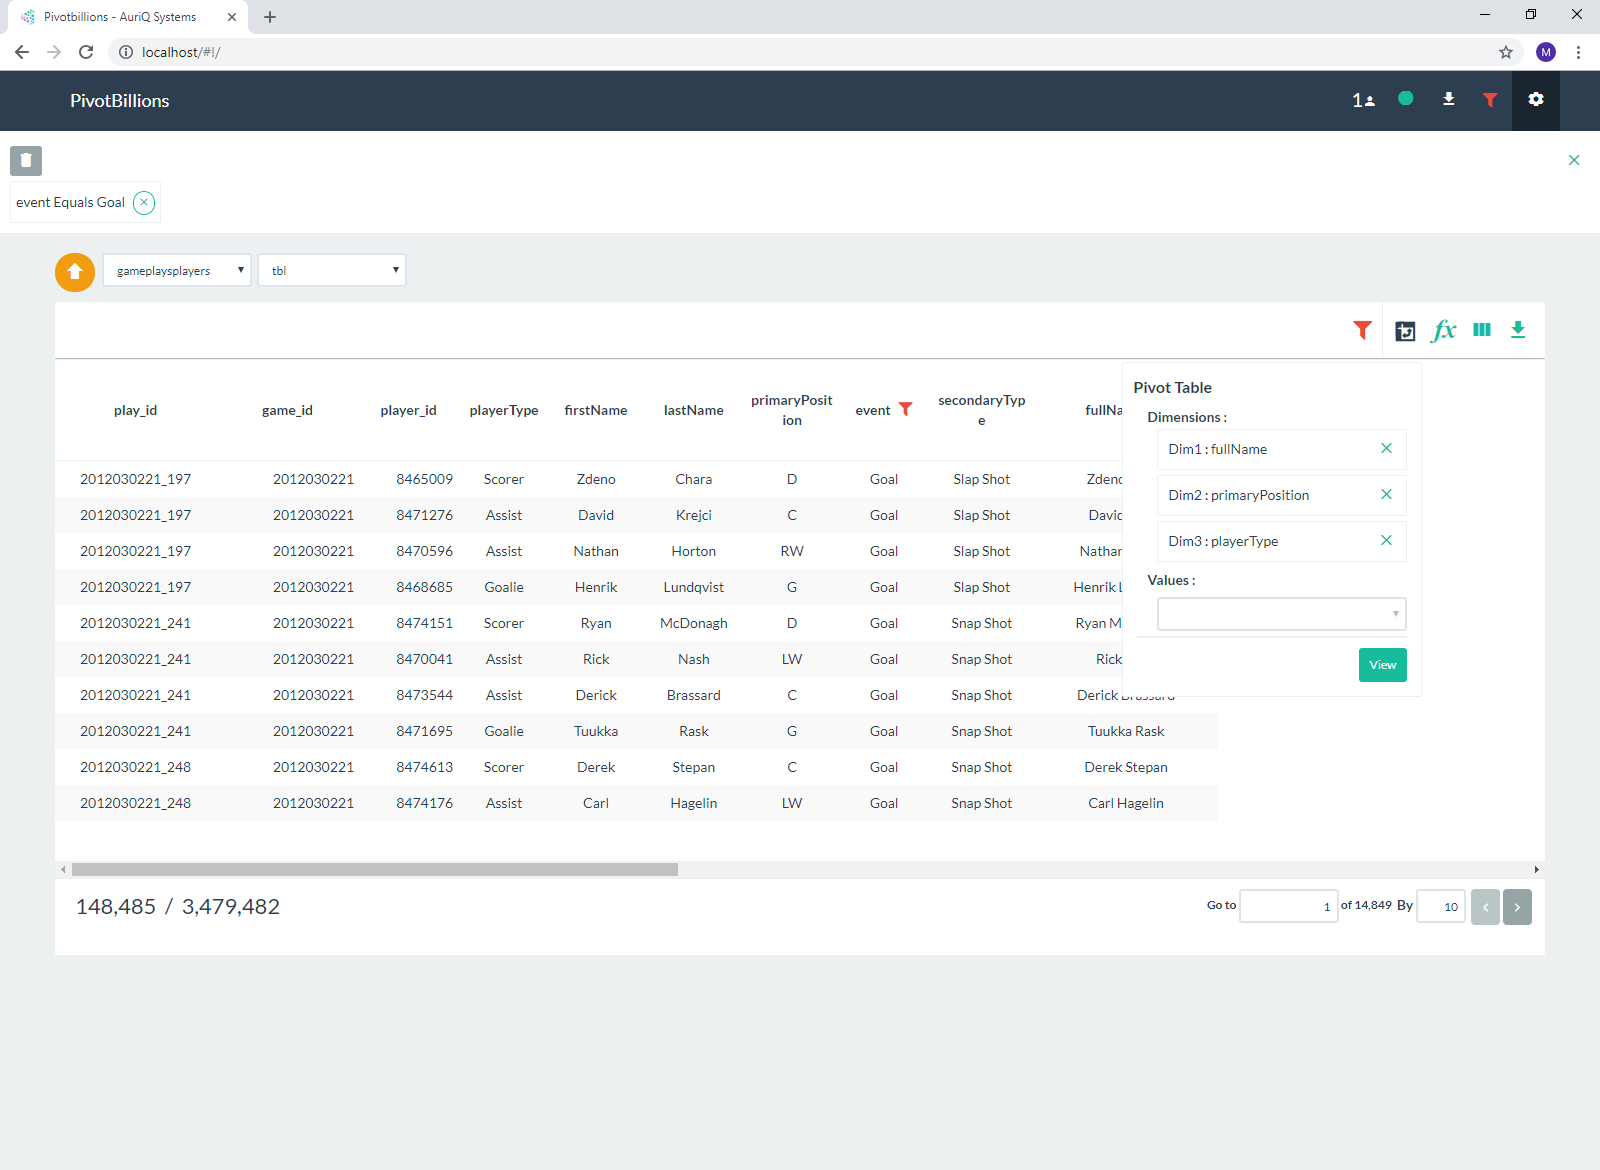
We can now immediately see in the pivot table that in a goal event, there are three types of players involved. The scorer, any assist player, and the goalie. With regard to position, we see that the Center and the Goalie(obviously) are the most involved in goal events. Interestingly, the Defenseman position contributes overall to more goals than either wing position.
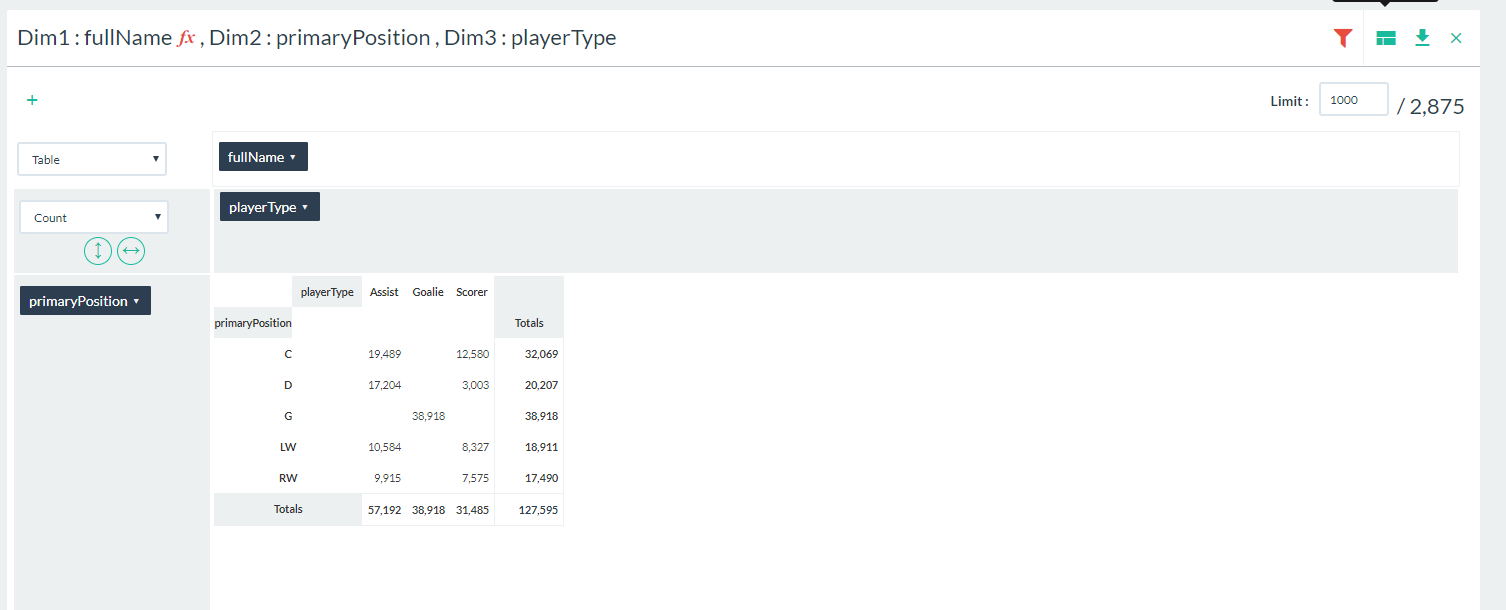
By deselecting the goalie player type and adding the full name, we can find out which players contribute the most toward a goal in either scores or assists.
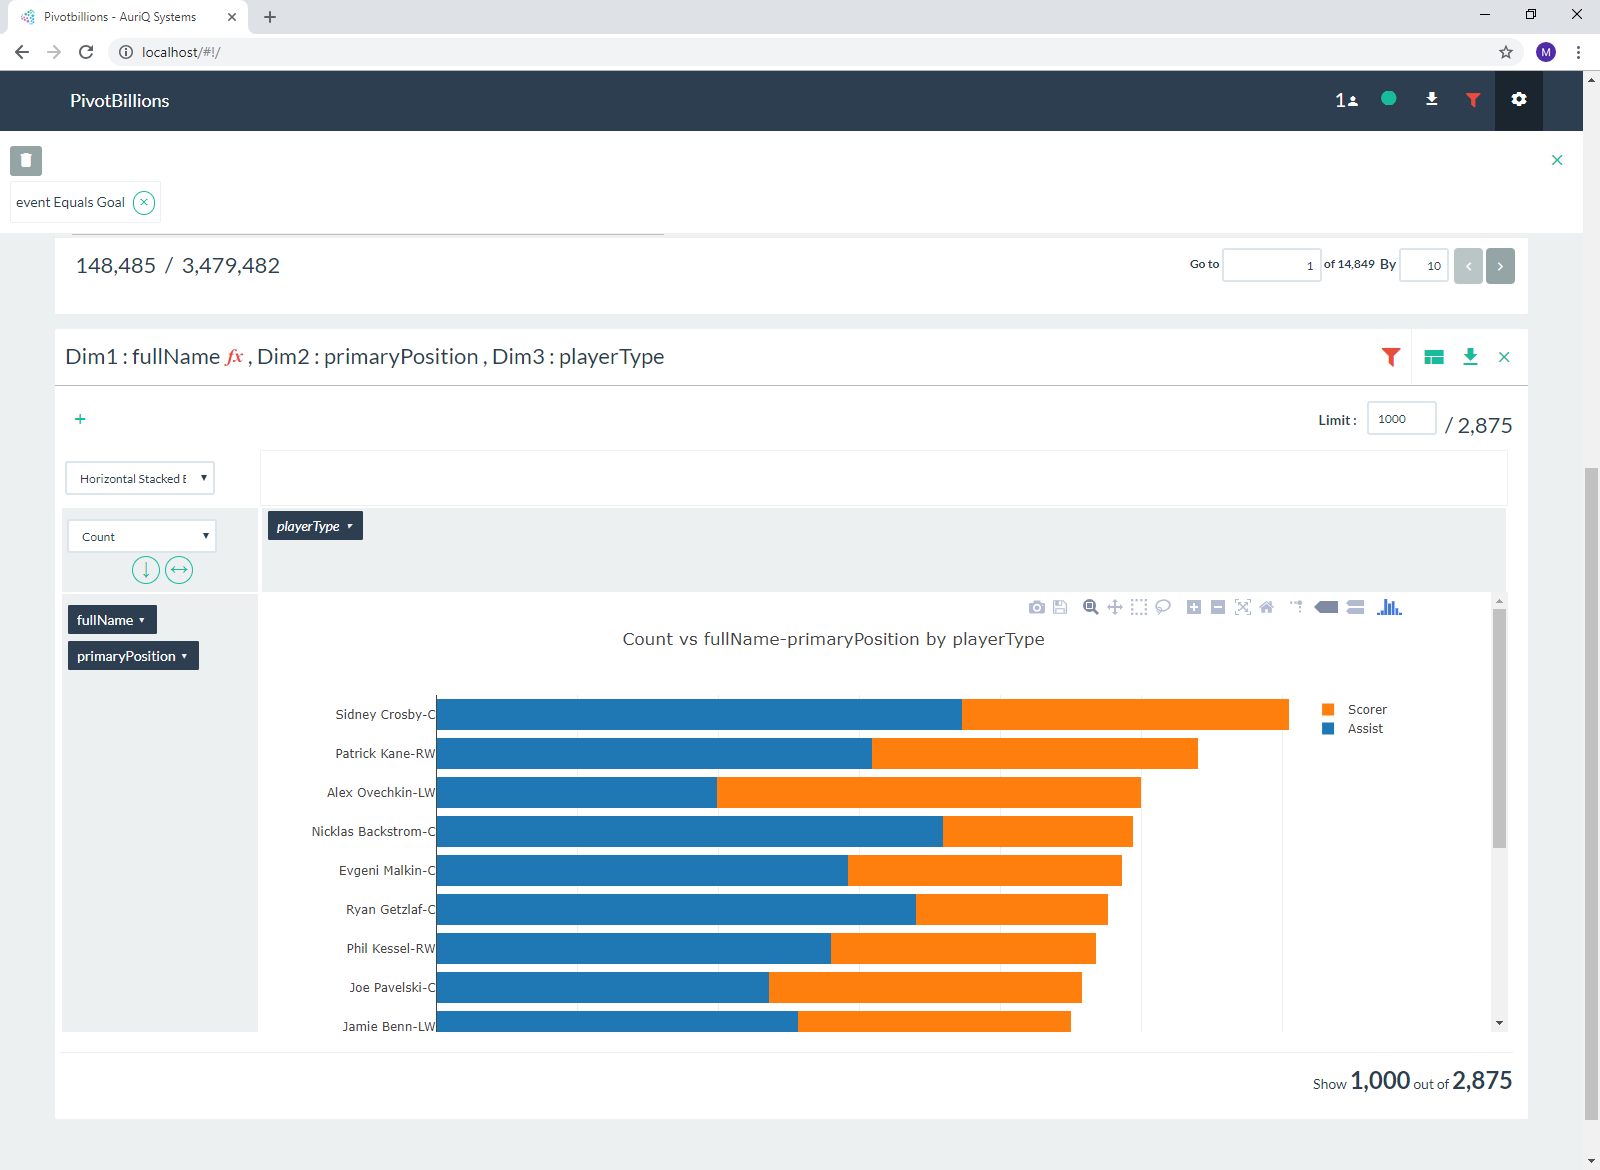
Sidney Crosby (Center) and Patrick Kane (Right Wing) lead the pack of players from 2012-2016 in overall contribution to their teams' goals.
This extremely powerful analysis allows us to start to put together the ideal NHL fantasy team as well as compare existing teams by their individual players. Aside from the stats in the dataset, you can derive other common hockey metrics such as the Corsi and the Fenwick along with the provided plus minus stat. It could also be used by NHL recruiters to determine which players might be the best fit for their team to increase their win percentage.

