Incorporating Pivot Billions into your R analysis workflow can dramatically improve the research cycle and your ability to get results.
R is a great statistical analysis tool that a wide variety of data analysts use to analyze and model data. But R has limits on the data it can load onto your machine and tends to dramatically slow down past a certain number of data points. To facilitate faster turnaround times when using R, we incorporate Pivot Billions into the workflow for fast data exploration and enhancement.
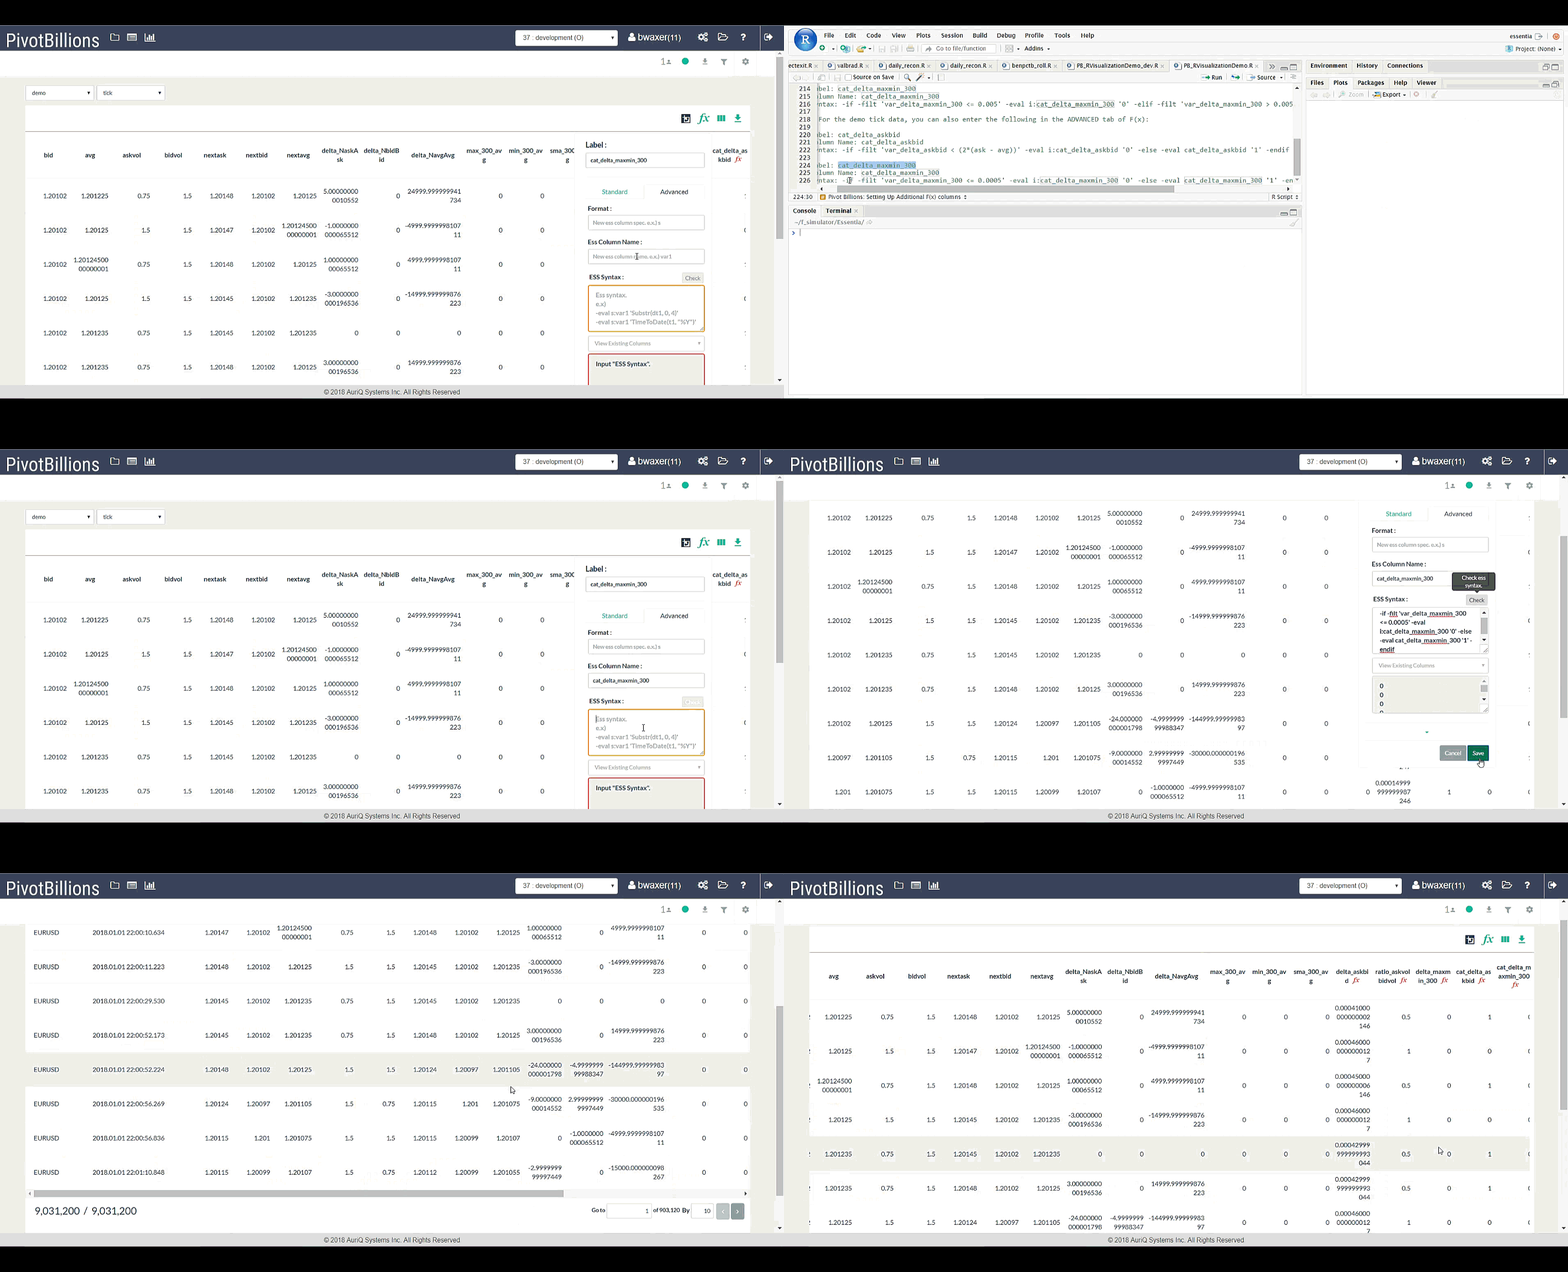
R users can appreciate that even after the data is loaded, you can still modify and interact with the data on the fly from Pivot Billions' interface. Adding new features such as calculations based on existing columns is facilitated through a column creation function directly accessible from the Pivot Billions UI. This allows any user to quickly add additional features to the data even after it was imported and then easily export the data to R.
As a real word example, we loaded over 444 MB of EUR/USD Currency Tick Data, approximately 9 million rows, to predict price increases in the currency pair in the currency exchange market. Using Pivot Billions, installed locally on our laptop, we are able to explore the raw data files, add transformation rules to enhance data, and load all of it into the Pivot Billions in-memory database in less than two minutes. In this case, Pivot Billions acts as both a data warehouse and an EDA tool.
From the report interface, we quickly add some new features including:
- delta_maxmin_300) - the difference between the maximum and minimum close prices over the last 300 minutes
- (delta_CO) - the difference in the current minute’s close and open prices
- (delta_NcC) - the difference between the next minute (future) and current close prices.
This last feature is the value we’re most interested in being able to determine. If we can discover rules that govern whether the price will go up in the next minute, we can apply that to our currency trading strategy.
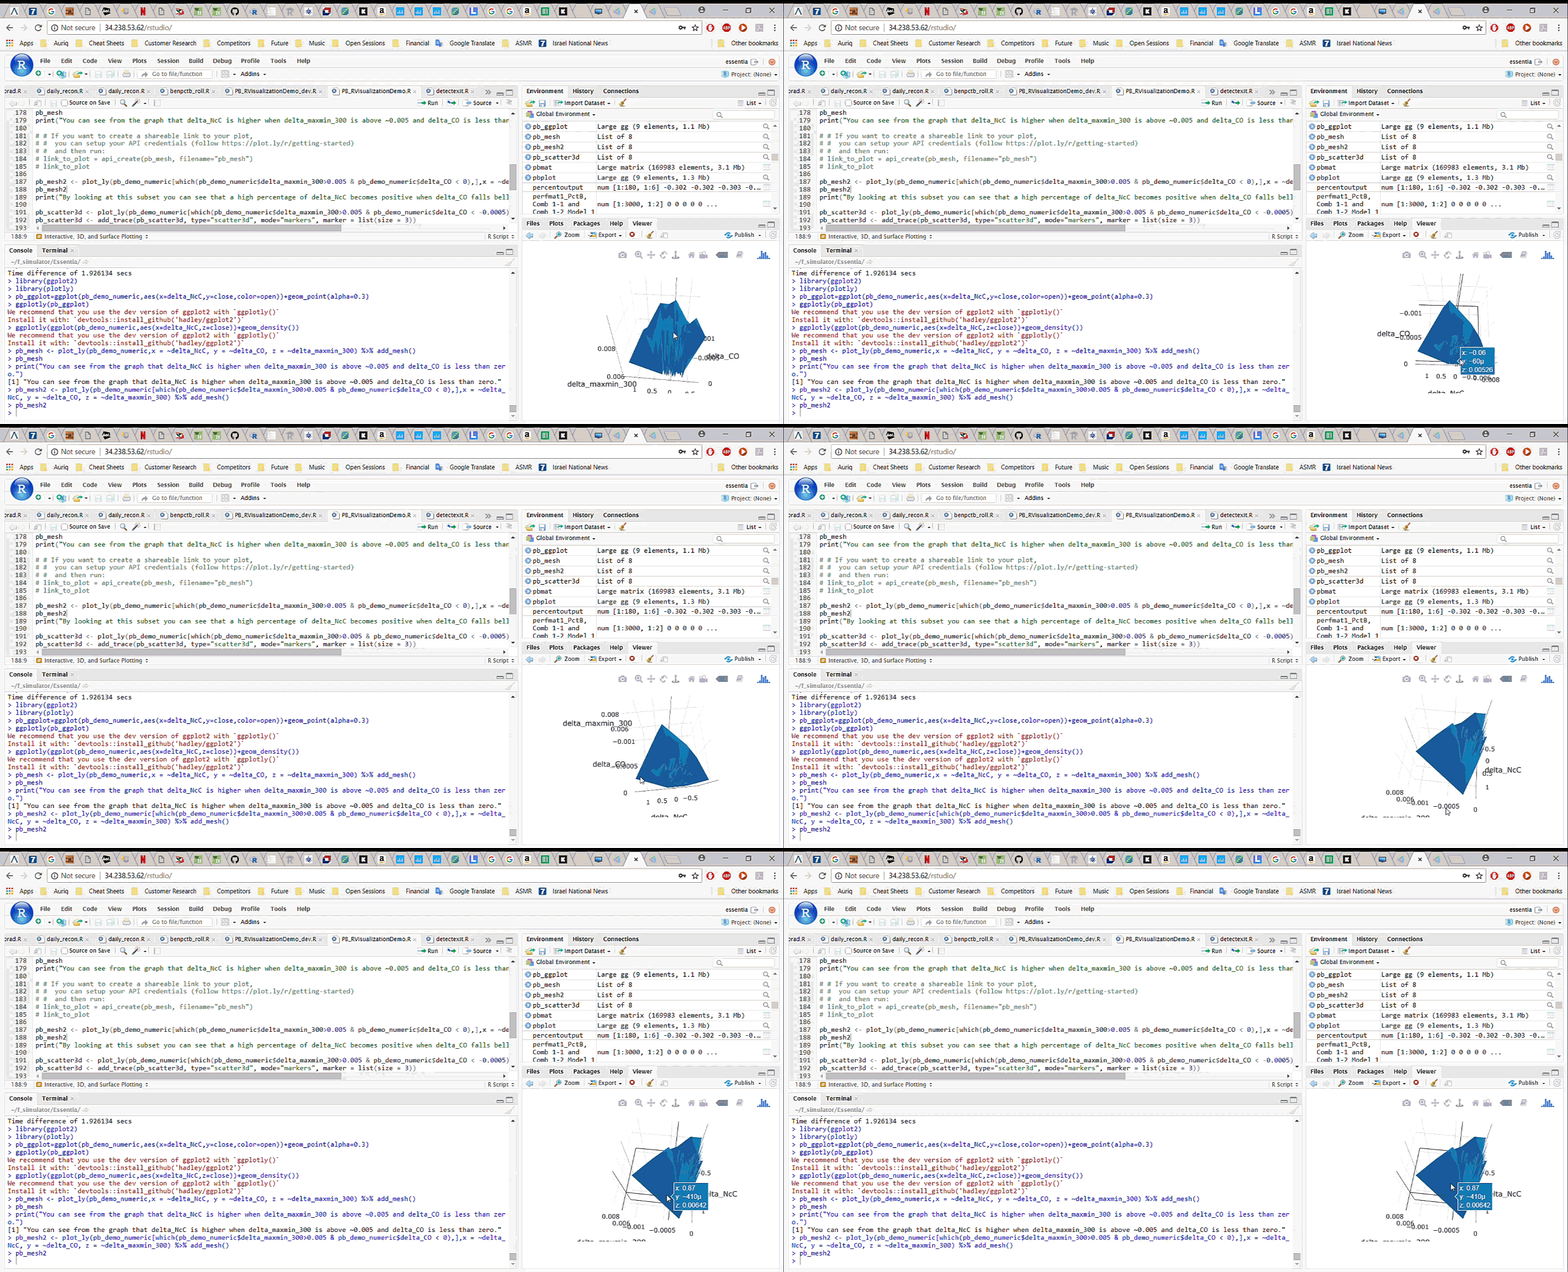
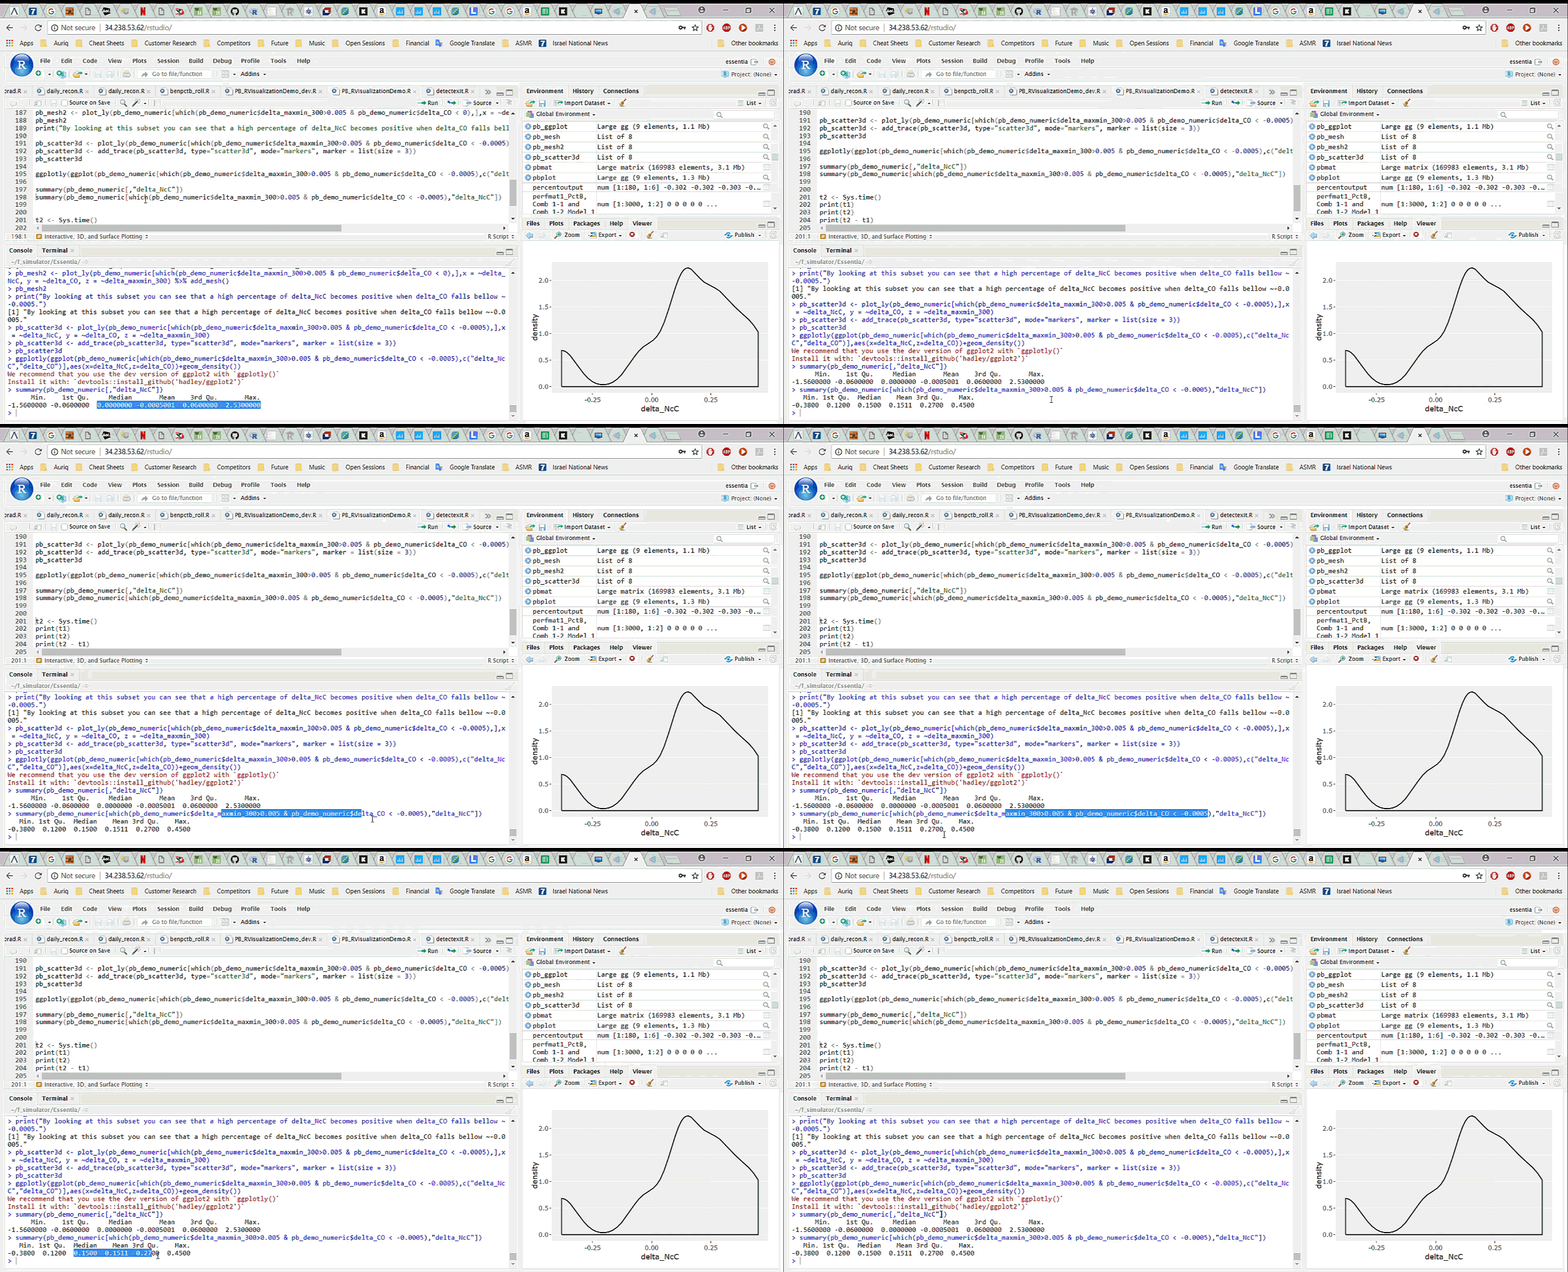
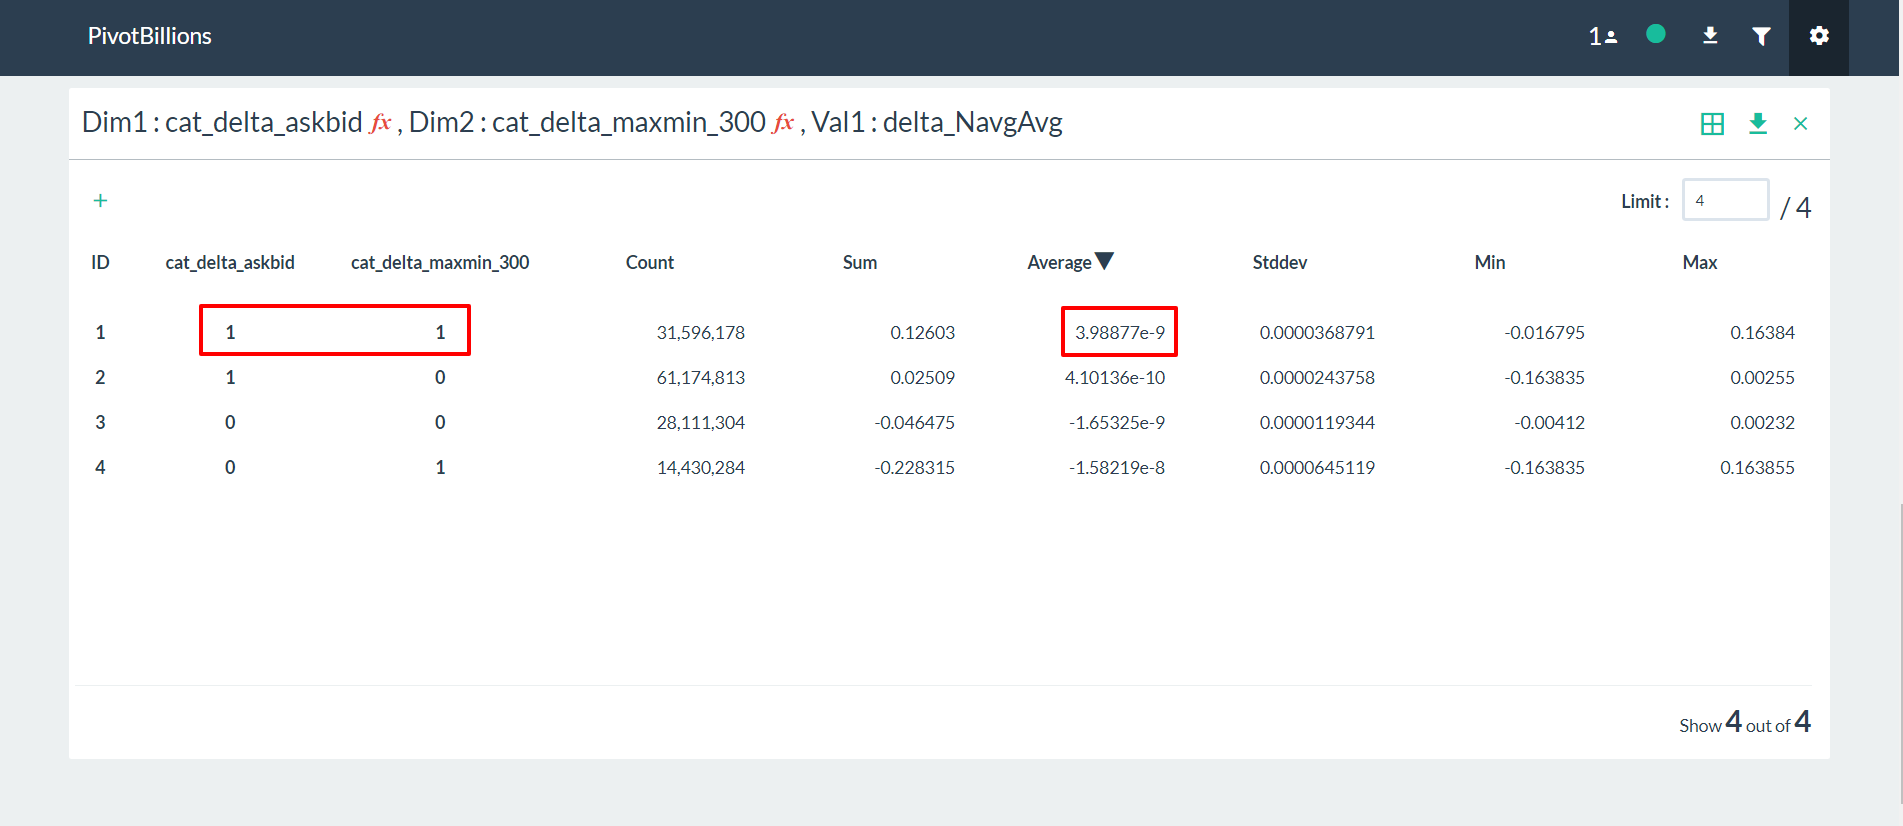
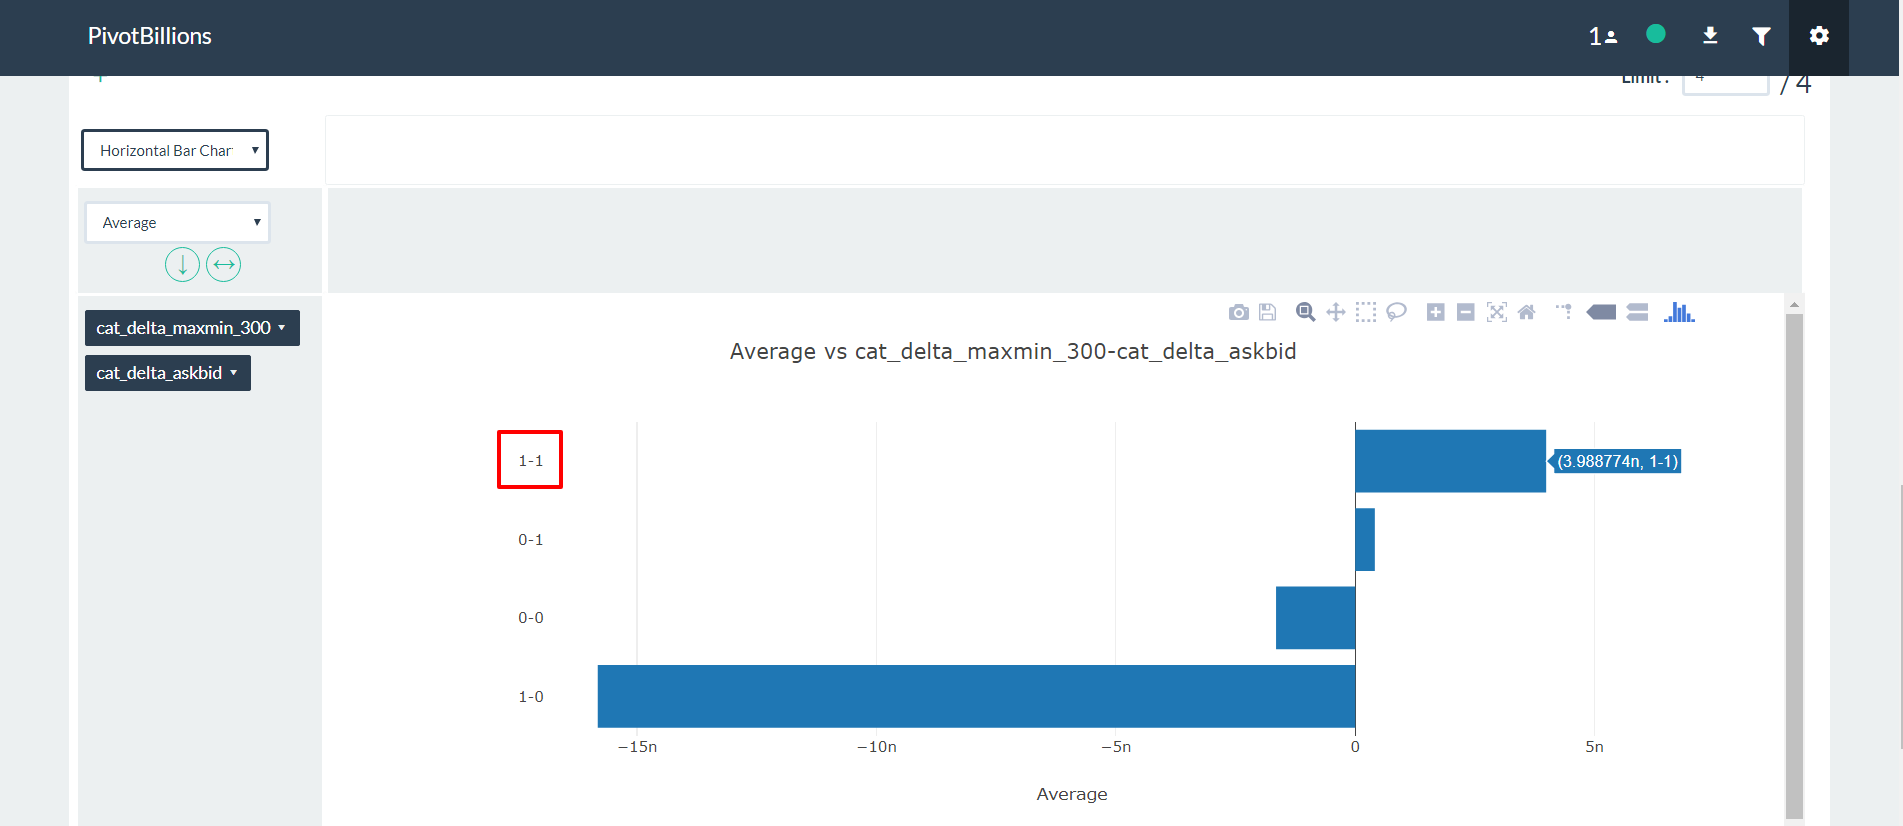
To start working with the data in R, we simply download it, with all the newly added features, from Pivot Billions and read it into R. By analyzing and visualizing the data in R we can quickly drill down into the key features and how they affect the currency price. We explore the relationship between the difference in the mid term maximum and minimum, close and open price, and the next period close price and the current close price. It appears that selecting certain thresholds for these features can accurately predict an increase in the close price for the next minute.
To further validate our findings, we applied the same process on the much larger data set of 135 million rows (5 years of currency tick data) on a memory optimized EC2 instance in AWS. The results showed the same behavior on the much larger data set.
Although we ultimately derive our predictive model in R, we used Pivot Billions as our workhorse to get the large quantity of data prepared, enhanced and in a format that can be quickly and efficiently used within R. To follow along and view the R code for this example usecase, go through our Pivot Billions and R Visualization Demo.

