Data comes with a price. Accuracy comes with an even greater price. And the two together can demand enormous resources. That’s why it is important to achieve the greatest efficiency in your research process and make use of any tools that can help you. This is particularly true if you are trying to develop a currency trading model that is based on data from highly granular tick by tick values.
The Pivot Billions team has been working on this use case because it's an interesting and challenging real world application of Pivot Billions. Each currency pair that we wanted to develop a trading model for starts with historical tick data for a 5 year period, with roughly 140 millions rows that need to be analyzed. 140 million rows is pretty large, and that's for just one currency pair. Our modeling goals were to be able to develop models for multiple currencies.
Incorporating PivotBillions allowed me to access the full granularity of my currencies’ tick data throughout my research cycle. From loading and accessing all of the data, to enhancing the data with additional features, to exploring the distribution of the data across these features and even pivoting my data by these features to explore their effect, my massive data became something I could actually tame.
Now, even when you have access to and control of your data, to develop consistent trading models takes many, many iterations. What has taken me minutes or even hours in other tools was reduced to mere seconds using PivotBillions. While waiting a few minutes for results may be acceptable for a single test simulation, it can cause insurmountable hurdles when running many iterations and can prevent any optimizations or extensive modelling from being run on large amounts of data.
For example, if your test simulation time on 1 year of tick data takes on average 60 seconds, and you explore 1000 trading models, it will take you roughly 17 hours just to run them. If you need to run the same simulation for a 5 year period and assume that the added time to run it goes up linearly, it will take about 85 hours. This of course is an oversimplification, and run times for simulations can take much longer based on the complexity of the model, but in general you can see that the time to run just 1000 models can be ridiculously long.
That's why we developed our own time series database and trading module that runs on the Pivot Billions data processing platform to achieve extremely fast simulation times. By doing so, we reduce the run time for a simulation of 5 years of tick data to about 10 seconds on average. So that 5 year simulation that took about 85 hours to run in other trading simulators would take about 7 hours in Pivot Billions. That's over a 90% reduction in total run time! In fact, this was early on in our development, and since then we've been able to optimize the simulation almost 1000 times faster.
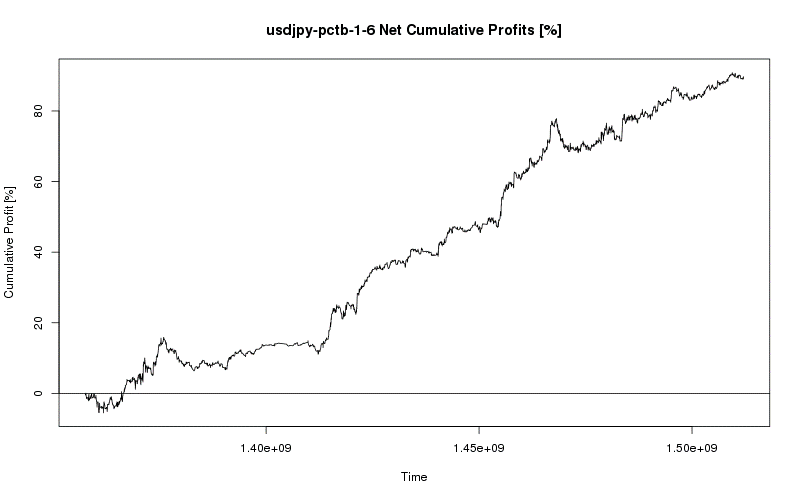
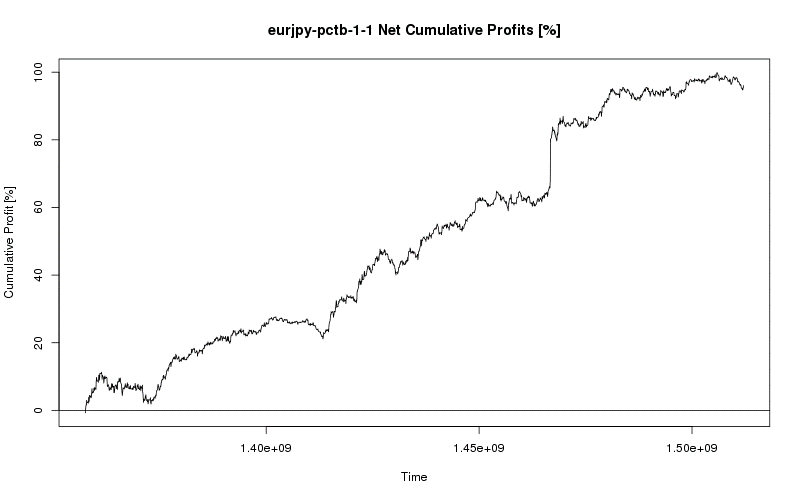
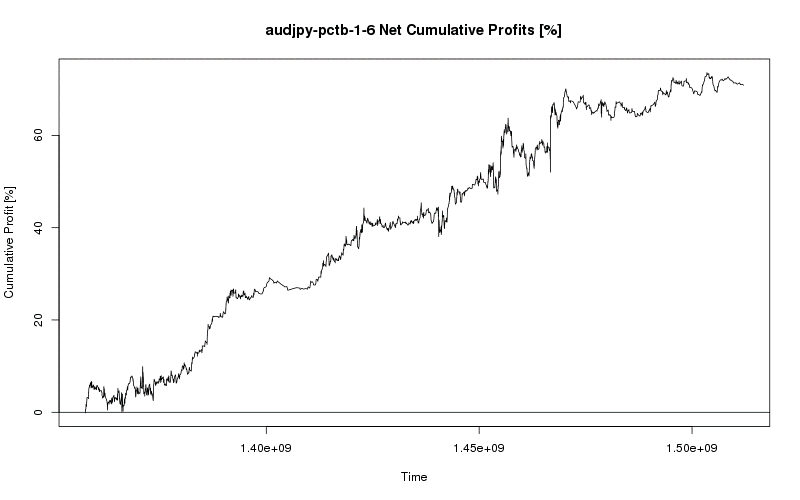
With this capability, I was finally able to fully dive into my features and run optimizations from R incorporating hundreds of thousands of simulations across hundreds of millions of raw tick data points to find trading models that continued to make profit over a five year timeframe.
Even after developing my trading model for one currency, I was able to seamlessly transition to another currency and apply my process. Quickly diving into the many possible features and optimizing a vast number of parameterizations to find a model that works consistently was even easier the second time around and soon I had my second model. This process continued until I had four profitable, consistent, and viable models for the EUR/USD, AUD/JPY, EUR/JPY, and USD/JPY currency pairs.


The whole process can be accomplished using the free PivotBillions docker image. If you need help using these features, contact us at info@pivotbillions.com.

