Amazon continues to be one of the most popular marketplaces in the US as well as the world due, at least in part, to its variety of product categories and product reviews. But how accurate are these reviews?
Do sellers or their competitors try and influence them in any way? Does the Verified Purchase tag actually affect the ratings? These questions nagged me until I finally gave in and decided to analyze Amazon’s Customer Review Dataset hosted on S3.This massive dataset contains over 130 million individual customer reviews stored in S3 tab separated files organized by product category.
I was mainly interested in the digital product reviews since they were easily verifiable by Amazon so I quickly connected to this data and created a category for the digital product categories using Pivot Billions. Then I used Pivot Billions’ column creation feature to extract the month from the review’s date column and loaded the data
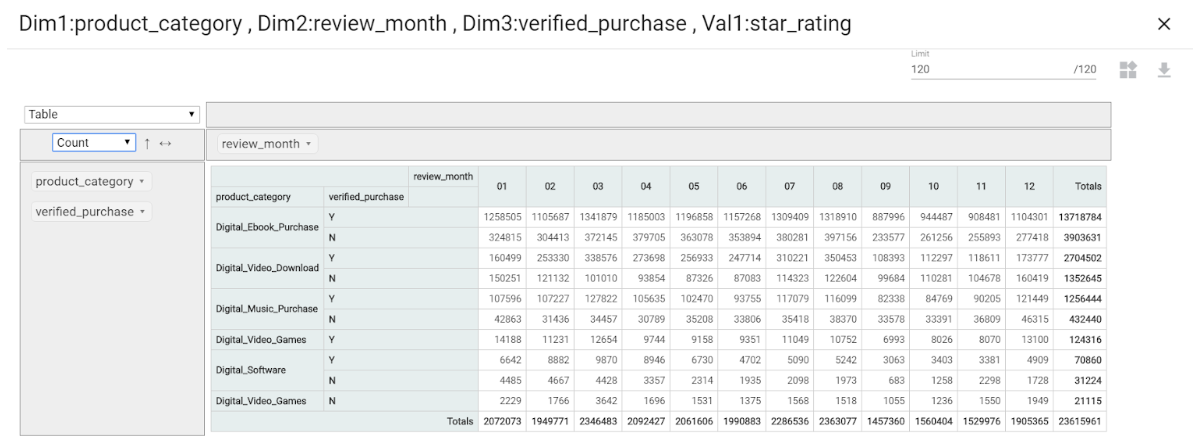
Now that I had access to the over 23 million reviews in Amazon’s digital product categories, I could now explore each categories’ ratings and the effect of the Verified Purchase tag. I quickly pivoted my data by the product category, review month, and verified purchase columns to get an idea of the data’s makeup.
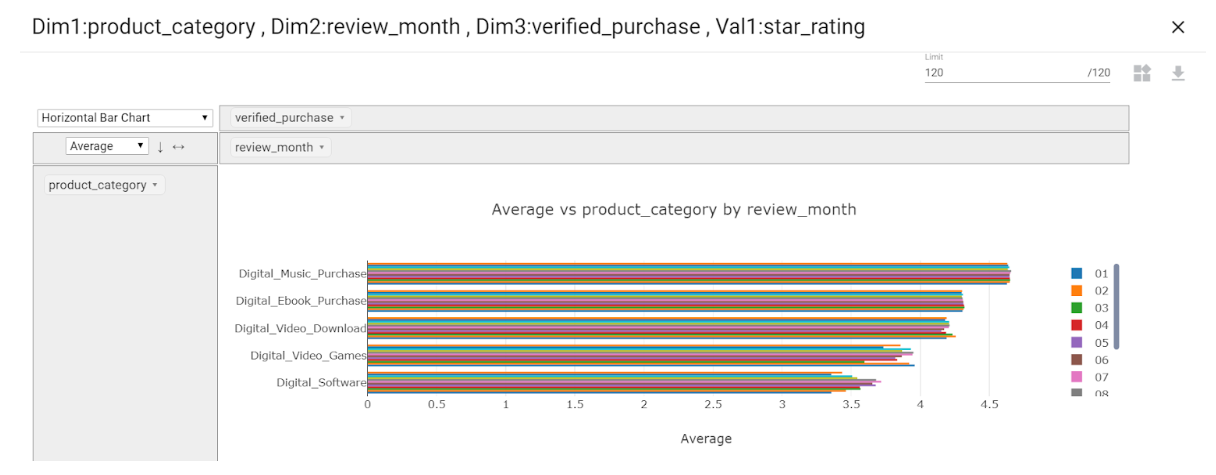
Digital Ebooks clearly made up the greatest proportion of reviews in the digital category. Given Amazon’s roots as an online book seller, this made a lot of sense. Now that I knew more about the distribution of the data and had made sure that the number of reviews for each product category was large enough to be used, I wanted to explore how the average star rating compared between categories. Switching from viewing the count to average for the star rating column and viewing the pivoted data as a horizontal bar chart I was left with a clear graphic of the ratings for each category over time.
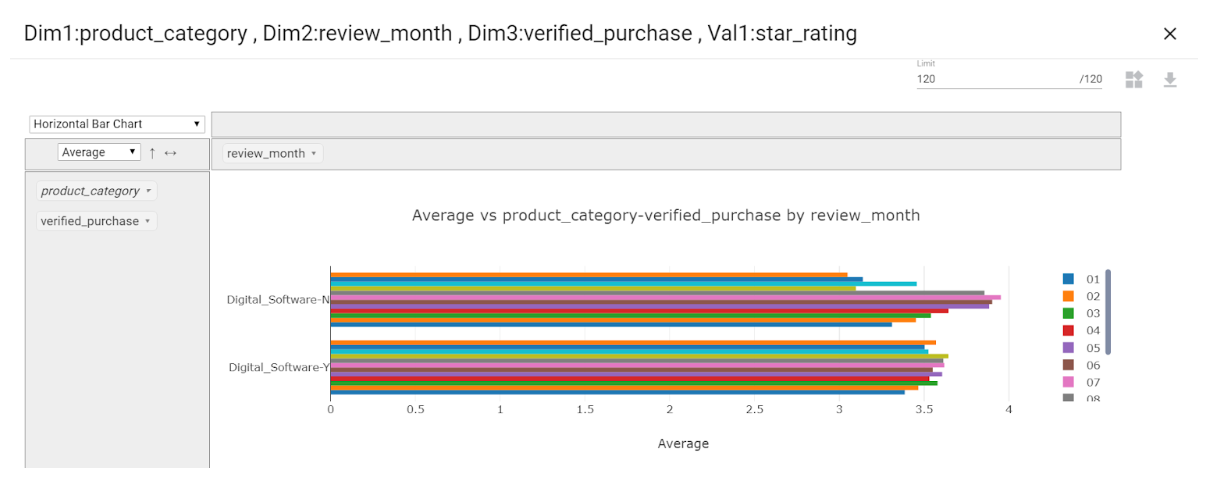
I could clearly see a hierarchy among the digital product categories. Even with their variation over time, the video game and software categories were rated much lower than the others and significantly lower than the music category. However, digital software had an interesting ratings spike during the summer months. Wanting to dive deeper, I narrowed down to that category and added in the Verified Purchase tag to the pivot.
Surprisingly, the variation during the summer months came primarily from Non-Verified purchases while Verified Purchases remained relatively steady. This could indicate attempts to influence software reviews by a seller or one of their competitors or possibly a greater range of products that didn’t have a verification system through Amazon.
So it appears that there are significant differences in the ratings of the digital product categories, with music typically rated much higher and software and video games rated significantly lower. Moreover, the Verified Purchase tag does have a large effect on the ratings in some instances. This could indicate cases of fraudulent reviews so I dug deeper.
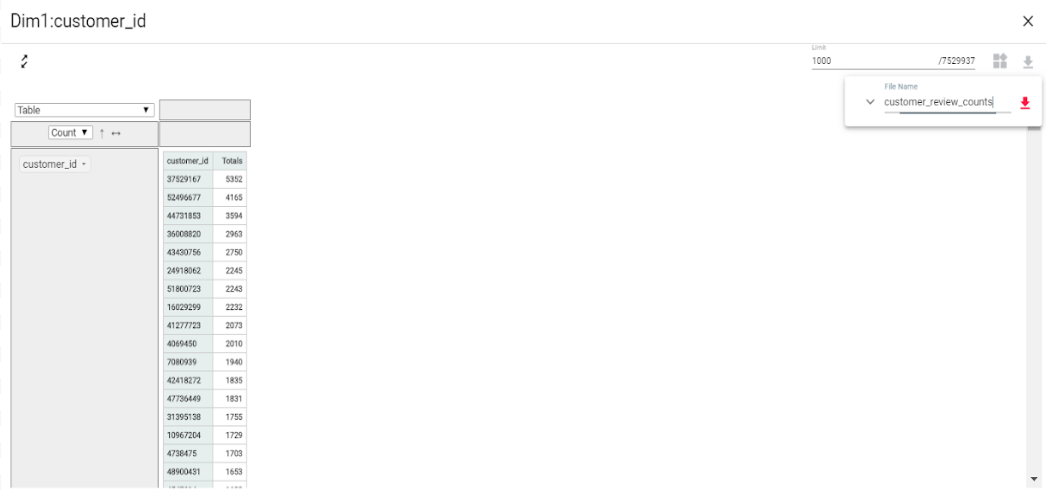
First, I re-pivoted the data by customer_id to get an idea of how many reviews each customer had.
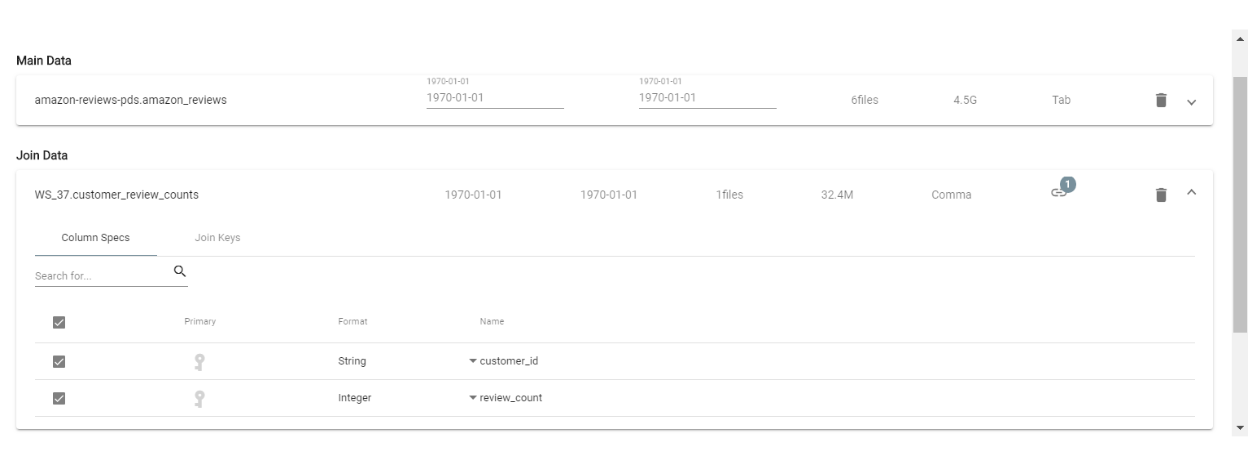
Then I exported this data and joined it into my main data using Pivot Billions.
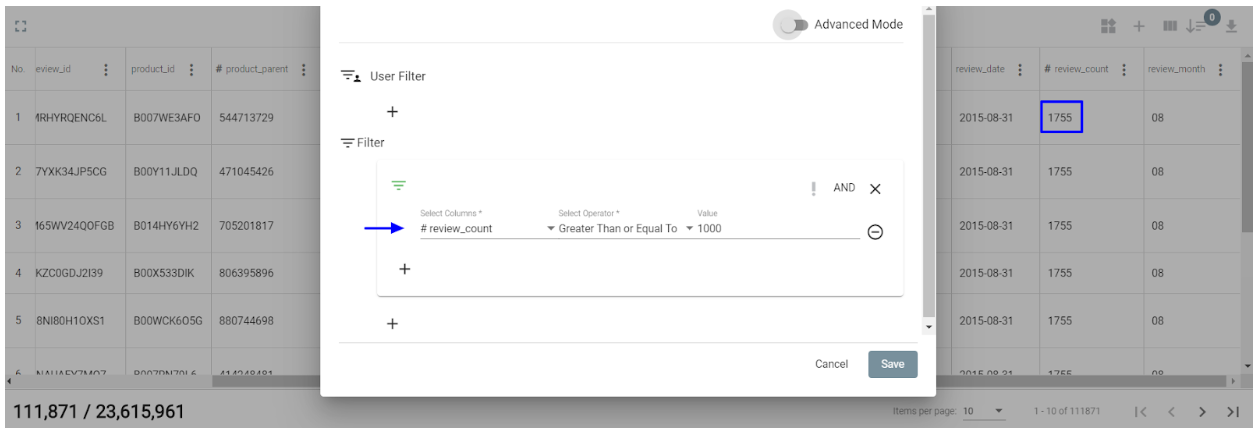
Now that my data was enhanced with the number of reviews each customer had submitted, I quickly restricted the data to only those customers with at least 1000 reviews in the data.
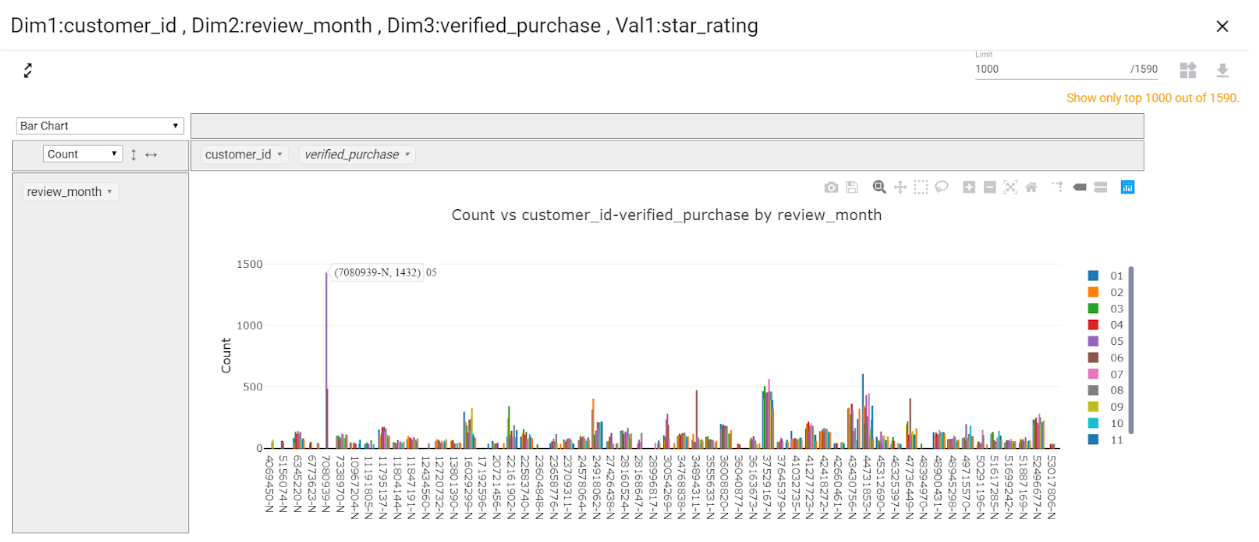
By quickly re-pivoting the data by the customer id, review month, and verified purchase columns and filtering the data to only the Non-Verified purchases, I started to see some suspicious behaviors.
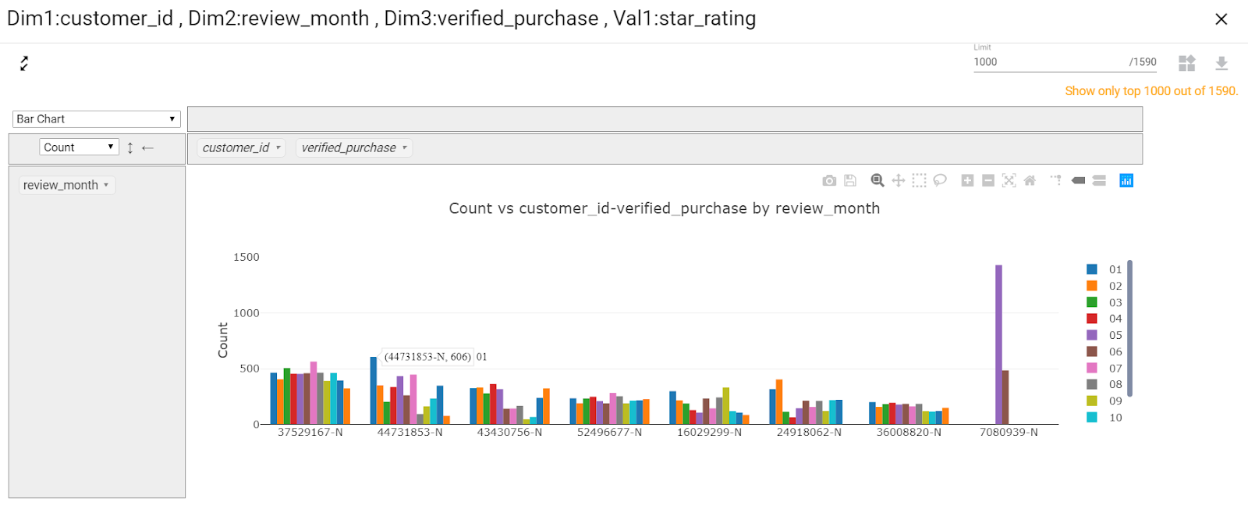
Narrowing down this graph to just a few of the customers with the greatest degree of unverified reviews, I was able to isolate their behaviors and view them in more detail.
I could clearly see that some of the customers consistently submitted a high number of unverified reviews throughout the year (Ex: ID 37529167) whereas others were more concentrated events (Ex: ID 7080939). Due to their number of reviews and unverified status, these customers were highly likely to be fraudulent reviewers.
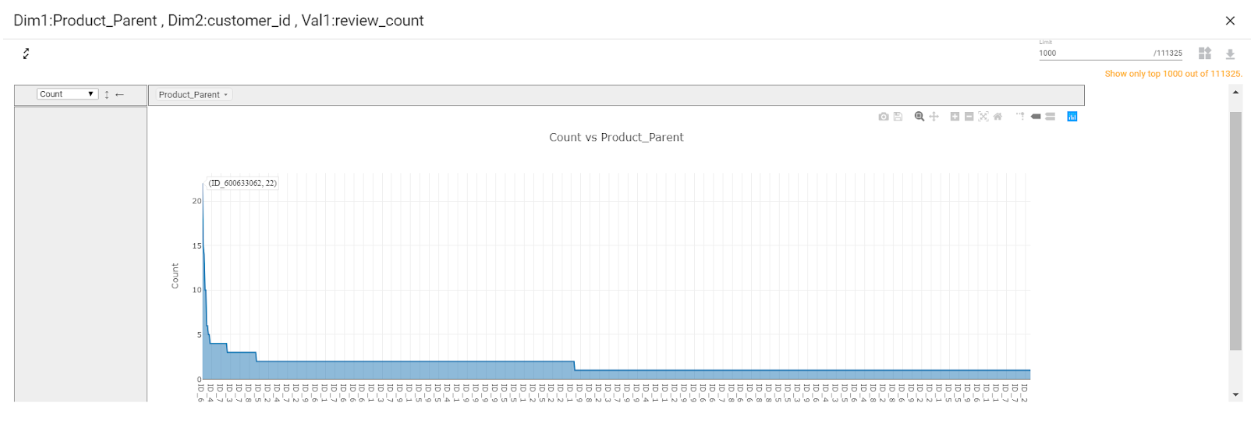
Now that I had a list of customers with suspicious behavior I wanted to see which products were affected the most so I pivoted the data by product parent, customer id, and review count and sorted by number of reviews.
I now had a clear view into which products saw the greatest number of these suspicious reviews. In fact, one product had over 22 unverified reviews from just this limited set of customers!
While Amazon is extremely popular and does have a vast database of verified reviews, it's clear there are still a variety of fraudulent reviews dispersed throughout the data that can have isolated or cumulative effects on their products. It is worth Amazon’s time to look into these reviews in greater detail and try to expand their Verified Purchase tag as much as possible. In the meantime make full use of Amazon’s extensive review system but you might want to check that the reviews are Verified before buying an expensive item or if you’re on the fence.


