Pivot Billions
Skip to content
  • Product
    • Data Collection
    • Data Analysis
    • Conversion Prediction
  • Use Cases
  • Resources
    • Knowledge Base
    • Videos
    • GitHub
    • Docker Version
  • Blog
  • Demo

Category: Tableau

All ETL Kaggle Tableau

Visualizing Gender Disparities in Hi-Tech, Engineering, and Science

by pivotteam on March 13, 2019

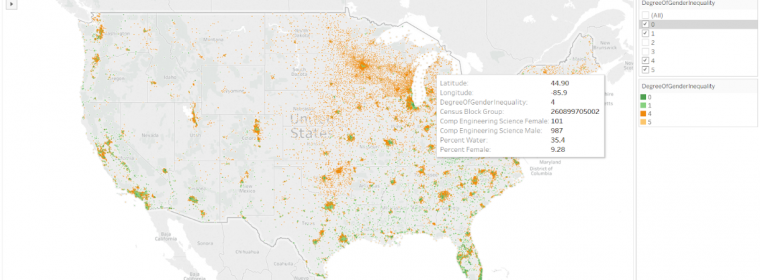
We’ve all heard about the many improvements and changes being made to help get women into Hi-Tech and the Sciences, but where are these improvements being seen? Is the entire nation reaching gender equality or are there pockets of improvement and pockets of stagnation. These are the questions I set out to answer using the […] continue reading »

All Kaggle Tableau

San Francisco – A City Full of Psychopaths?

by pivotteam on January 31, 2019

With a population of over 800,000 people within approximately 47 square miles, San Francisco is one of the most densely populated cities in the United States. Cities with this level of population density must contend with a high level of policing activity to ensure safety. I wanted to explore just how safe it actually is […] continue reading »

All ETL Tableau

Do the holidays mean bigger tips for NYC taxi drivers?

by pivotteam on December 31, 2018

The holiday season brings with it a degree of cheer and joy that many claim makes people act friendlier towards each other. I wanted to see how this effect translates to action so I decided to look into tips for New York green taxis both during the holiday season and the rest of the year. […] continue reading »

5 Minute Analysis All ETL Kaggle Tableau

Simplifying Iowa Liquor Sales Data for Loading to Tableau

by pivotteam on October 19, 2018

  Overview In this 5 minute analysis, we pre-process, map, and explore complicated public sales data for liquor stores in Iowa to extract relevant latitude and longitude from a problematic column in the data. We want to filter the data for the city with the most sales and prepare it for easy loading into the […] continue reading »

Recent Posts

  • Real-time analysis of 50 billion records of IoT data
  • Enhancing Trading Models with AI
  • 5 Minute Analysis of Data.gov Datasets with PivotBillions
  • Maximizing Sales with Market Basket Analysis
  • Exposing Potential Fraud in Amazon Reviews

Categories

  • 5 Minute Analysis
  • All
  • Artificial Intelligence
  • Big Data
  • Complete the Picture
  • Data.gov
  • Deep Learning
  • Docker
  • EDA
  • ETL
  • FX Analysis
  • Health Data Analysis
  • Kaggle
  • Machine Learning
  • Python
  • R
  • Tableau

Useful Sites

  • Kaggle
  • Data Science Central
  • Tableau Public
  • R-bloggers
Copyright 2020 AuriQ Systems, Inc. | Policies and Terms
This website uses cookies to improve your experience. We'll assume you're ok with this, but you can opt-out if you wish. Cookie settingsACCEPT
Privacy & Cookies Policy

Privacy Overview

This website uses cookies to improve your experience while you navigate through the website. Out of these cookies, the cookies that are categorized as necessary are stored on your browser as they are essential for the working of basic functionalities of the website. We also use third-party cookies that help us analyze and understand how you use this website. These cookies will be stored in your browser only with your consent. You also have the option to opt-out of these cookies. But opting out of some of these cookies may have an effect on your browsing experience.
Necessary Always Enabled

Necessary cookies are absolutely essential for the website to function properly. This category only includes cookies that ensures basic functionalities and security features of the website. These cookies do not store any personal information.

Non-necessary

Any cookies that may not be particularly necessary for the website to function and is used specifically to collect user personal data via analytics, ads, other embedded contents are termed as non-necessary cookies. It is mandatory to procure user consent prior to running these cookies on your website.